

Introduction: Your Campaign Was Working Yesterday. What Changed?
Yesterday the campaign was profitable. Today it’s getting the same traffic, maybe more, and conversions have almost disappeared. Nothing in the dashboard screams “here’s the problem” — spend looks normal, clicks look normal, and yet the CR line is flat on the floor.
The first instinct is to do something. Kill the creative. Bump the bid. Swap the offer. Blame the source. Most media buyers have made at least one of these moves within the first ten minutes of noticing a drop, and more often than not it’s the wrong move, because it treats the symptom as if it were the diagnosis.
A conversion drop is a symptom. It tells you something changed somewhere between the impression and the payout. It does not tell you where. The traffic could be fine and the tracking broken. The creative could be fine and the offer capped. The funnel could be fine and one GEO could be dragging the average down while everything else is untouched. Acting before you know which of these it is just adds a second variable to a problem you haven’t identified yet — and now you have two things to untangle instead of one.
This is where AI is genuinely useful, and also where it gets oversold. A language model can look at a pile of campaign data faster than a human can scroll through it, spot which segment moved the most, and phrase a testable hypothesis in plain English. What it can’t do is walk into your tracker, check the offer’s actual status with the network, or confirm the postback is firing. It doesn’t have your data unless you give it your data, and it doesn’t know what it doesn’t know. Used right, AI turns a messy spreadsheet into two or three things worth checking first. Used wrong, it turns a guess into something that sounds like a fact.
Why Affiliate Campaigns Suddenly Stop Converting
Before touching anything, it helps to know the actual list of things that can break. In practice, almost every sudden drop traces back to one of six areas.
Traffic Quality Changed
The same source, the same volume of clicks, but a different mix of people behind them. A traffic source can quietly shift its inventory — more bot-adjacent placements, a new publisher added to the pool, a change in how it fills your targeting. Volume holds steady or even grows while the people arriving are less and less likely to convert. This is one of the easiest things to miss because the top-line click number looks completely fine.
The Funnel Changed
A landing page update, a redirect added for “tracking purposes,” an extra consent screen, a slower CDN, a broken mobile layout on one specific device — any of these can quietly cut the path between click and conversion without throwing an error anywhere. Nobody gets an alert when a page goes from 1.8 seconds to 4 seconds to load. Users just leave.
The Offer Changed
This is the one affiliates underestimate the most. Offers get paused, capped, geo-restricted, or redirected to a different product entirely — sometimes without a clear notification, and sometimes with one that lands in an inbox nobody checks daily. A widely discussed thread on the AffiliateFix forum is a good illustration: an affiliate was convinced the problem was on their end, while their affiliate manager insisted the backend was fine — and it turned out several of the offers had simply been paused by the advertiser, with the network slow to update the offer’s status on their side. Traffic kept flowing to a dead endpoint the whole time.
There’s a second version of this that’s sneakier: capped or paused offers get silently redirected to a different offer that may not match the GEO or format the affiliate was actually running, which can make well-targeted traffic suddenly look “unqualified” for no visible reason.
Conversion Tracking Broke
Nothing about the campaign changed at all — the tracking pipe did. A guide on affiliate conversion tracking lays out the usual suspects clearly: a redirect chain added upstream that strips the click ID, a cross-domain checkout that loses the cookie between subdomains, a postback that fires twice and gets deduplicated into nothing, or a parameter that silently stopped passing through. None of these show up as an “error.” They show up as conversions that quietly went to zero while everything upstream looks untouched.
The Shopify community has a textbook case of this exact failure mode, just from the other direction: a store owner reported that UK sessions had collapsed from 3,366 to 51 almost overnight, while sales stayed completely normal. Real users, real purchases, but the analytics layer had broken and was massively undercounting sessions. If that same pattern showed up in an affiliate context — conversions “disappearing” while the underlying business kept running fine — the honest read isn’t “the campaign died,” it’s “the counter died.”
Creative Fatigue or Audience Saturation
These two get lumped together constantly, and they’re not the same problem. Creative fatigue is about one specific asset losing its pull on people who’ve already seen it too many times. Audience saturation is about running out of new people entirely, regardless of how fresh the creative is. AppsFlyer’s creative analytics research puts a number on the first one: ad performance tends to drop 15–20% within the creative’s first two weeks, and the decline accelerates noticeably from week three onward. The tell for fatigue specifically is CTR sliding while impressions stay flat — people are seeing the ad, they’re just not clicking it anymore. The tell for saturation is reach itself flattening out even as spend goes up.
The mistake worth calling out here: a media-buying team at Aragil, an agency that builds creative-health dashboards, points out that most teams only watch campaign-level averages, and that’s the first mistake — a couple of strong creatives can mask two or three fatigued ones in the blended numbers for weeks before the average finally cracks.
The Traffic Source Changed
Algorithm updates, delivery changes, a new auction dynamic, or — less discussed but very real — a partner or sub-source added to your traffic mix without much warning. A Shopify merchant flagged exactly this in a community thread: a sudden spike in volume from one affiliate partner network, with almost nothing converting, that on closer inspection was routed through a chain of performance networks the merchant hadn’t vetted. They paused it and asked around, which is the right instinct — investigate before you scale, not after.
Don’t Optimize Yet — Diagnose First
The wrong sequence is familiar: CR drops, campaign gets paused, a new creative goes live, and three days later nobody actually knows if the new creative fixed anything, because the underlying cause was never identified. Maybe the new creative “worked” — or maybe the tracking issue that was silently killing conversions resolved itself and had nothing to do with the creative at all. Either way, you’ve learned nothing you can reuse next time.
The right sequence is boring, and that’s the point:
Confirm the anomaly → isolate the metric → locate the broken funnel step → identify what changed → test the hypothesis → act.
Six steps, in that order, before a single dollar gets reallocated.

Fig. 1 — The funnel has five points where a conversion drop can originate, and each one leaves a different fingerprint in your data.
The Affiliate Campaign Troubleshooting Framework
Step 1 — Did Conversion Volume Actually Drop?
Sounds obvious, but the number of raw conversions on its own is close to useless without context. A drop from 40 conversions to 25 could be a real problem or could be a normal Tuesday if your baseline has that much natural variance. Pull CVR, CPA, EPC, and ROI alongside it. If conversions fell but so did clicks in the same proportion, CVR hasn’t actually moved — you have a volume problem, not a funnel problem, and that’s a completely different investigation.
Step 2 — Did Click Volume Change?
Check impressions, CTR, CPC or CPM, and spend. If clicks dropped, the issue is upstream — delivery, budget pacing, bid competitiveness, or the source itself throttling your campaign. This is a different branch of the tree entirely from a CVR problem, and conflating the two is one of the fastest ways to “fix” the wrong thing.
Step 3 — Did Conversion Rate Change?
This is usually the split that matters most. Stable clicks with a falling CVR points squarely at the funnel, the offer, traffic quality, or tracking — not the ad itself. If CVR is flat and everything downstream (CPA, EPC, ROI) still degraded, the cost side moved instead: CPC/CPM went up, or the payout changed.
Step 4 — Where Exactly Did the Funnel Break?
Walk the actual path: Impression → Click → LP Visit → Offer Click → Conversion. Wherever the drop-off ratio between two adjacent stages looks abnormal compared to your baseline, that’s your break point. A sharp fall between LP Visit and Offer Click usually means the landing page or the offer presentation; a fall between Offer Click and Conversion usually means the offer itself, the advertiser’s page, or tracking.
Step 5 — Segment the Drop
This is the step most people skip because it takes longer than “just look at the campaign total.” Break the data down by GEO, device, OS, placement, publisher, sub-ID, creative, and hour/day. A campaign-wide CVR drop of 20% can easily be one GEO or one placement collapsing to near-zero while everything else is untouched — the blended number just hides it. This is exactly the mechanism the Aragil team describes with creative fatigue, and it applies just as much to GEO and sub-ID data.

Fig. 2 — Six steps, in order, before anything gets changed.
How AI Changes Affiliate Campaign Troubleshooting
What AI Is Good At
Feed a model a clean export of clicks, conversions, spend, and segments, and it’s genuinely fast at the mechanical part of this work: spotting which segment deviates most from baseline, running the comparison across GEO/device/placement in seconds instead of twenty minutes of pivot tables, summarizing what changed in plain language, and generating a ranked list of hypotheses along with the questions you’d need to answer to confirm or kill each one. That last part — turning “conversions dropped” into three specific, checkable statements — is the actual value.
What AI Is Bad At
It can’t prove causation from a correlation in the data, no matter how confident the output sounds. It has no idea an offer got paused unless that information is in what you gave it. It can’t detect a problem that isn’t represented anywhere in the dataset — if the postback silently stopped firing, the model just sees “conversions: 0” and has no way to know that’s a tracking artifact rather than a real collapse in demand. And on small samples, it will still produce a fluent-sounding explanation, even when the sample is too thin to support one. Voluum’s own guidance on AI-assisted iGaming workflows is careful about this: the useful prompts are things like “show me every campaign with negative ROI in the last 24 hours” or “which GEOs should get more budget this week” — narrow, data-grounded questions, not “tell me why this campaign died.”
There’s a broader pattern behind this. Marketing teams that have leaned hardest into AI-assisted reporting keep running into the same failure: an agency called Layer, cited in a recent look at reducing AI hallucinations in marketing reporting, described a client meeting where a single AI-generated CPC figure — pulled without cross-checking the source — nearly reshaped an entire quarter’s budget allocation before anyone verified it against the actual platform data. The fix wasn’t “stop using AI.” It was grounding every AI output in the team’s actual first-party numbers instead of letting the model fill gaps from pattern-matching.
The rule worth keeping in your head:
AI should rank hypotheses, not invent certainty.
Give AI the Right Data, Not Just a Screenshot
A screenshot of a dashboard gives a model almost nothing to work with — no segment breakdown, no baseline period, no way to compute a real delta. Export the underlying numbers instead.
| Data | Why it matters |
|---|---|
| Clicks | Traffic volume |
| Spend | Cost changes |
| Conversions | Outcome |
| CVR | Funnel efficiency |
| CPA | Acquisition cost |
| EPC | Revenue efficiency |
| Revenue | Monetization |
| ROI/ROAS | Profitability |
| GEO | Geographic anomalies |
| Device/OS | Technical and traffic differences |
| Placement/Sub-ID | Traffic quality |
| Creative | Fatigue/CTR problems |
| Offer | Offer-side changes |
An AI Diagnostic Prompt for Affiliate Campaigns
Here’s a version that actually holds up in practice. It works with a CSV or table pasted straight from your tracker.
You are analyzing affiliate campaign performance data. Compare the current period to the baseline period provided. For each segment (GEO, device, placement, sub-ID, creative), calculate the percentage change in clicks, CVR, CPA, EPC, and ROI versus baseline. Identify the segments with the largest deviations. For each deviation, propose a ranked list of hypotheses for the cause, and for each hypothesis state: (1) what evidence in this data supports it, (2) what evidence would be needed to confirm or rule it out that isn’t in this data, and (3) what should be checked manually first. Do not state a cause as confirmed unless the data conclusively shows it. If the sample size for any segment is too small to draw a conclusion, say so explicitly.
Fed clean data, a typical output looks something like this:
“CVR fell 61% overall. The drop is concentrated in Android traffic from Placement #4182, which accounts for 71% of the total decline despite being only 18% of total clicks. iOS and desktop segments show CVR within normal range. Hypothesis 1 (highest confidence): landing page or offer-side issue specific to this placement’s traffic — check LP load time and postback firing rate for Placement #4182 specifically. Hypothesis 2: traffic quality shift within this placement — check click timestamps for bot-like patterns. Not enough data here to confirm either hypothesis without checking the tracker directly.”
That’s a usable starting point precisely because it’s specific and it tells you what it doesn’t know.
Real-World Example: From a Sudden CR Drop to a Likely Root Cause
The numbers below are illustrative.
Baseline (last 14 days): 1,800 clicks/day · 4.2% CVR · $42 CPA · $1.85 EPC · +38% ROI
After the drop: 1,850 clicks/day · 1.9% CVR · $91 CPA · $0.97 EPC · –12% ROI
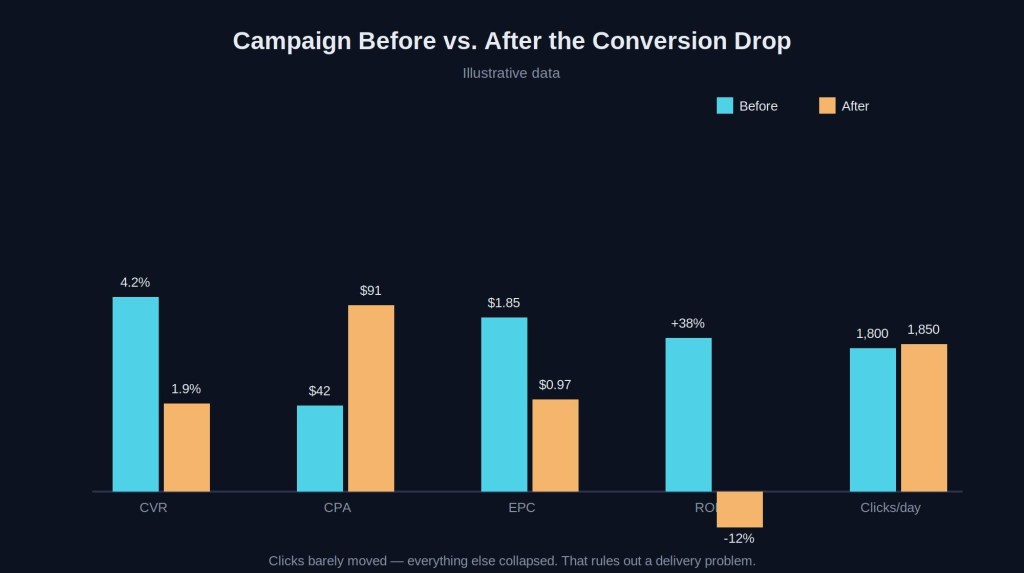
Fig. 3 — Clicks barely moved; everything downstream collapsed. That rules out a delivery problem.
Clicks are stable — actually slightly up. That already rules out a delivery or budget problem and points the investigation at CVR, the funnel, the offer, or tracking.
Segmenting the data shows the drop isn’t evenly spread. Desktop and iOS CVR are close to baseline. Android CVR has fallen from 4.0% to roughly 0.6%, and Android accounts for close to 40% of total traffic — enough volume to drag the blended average down hard while looking, at a glance, like a campaign-wide collapse.
Fed this segmented breakdown, an AI analysis flags Android as the dominant contributor to the deviation and lists two hypotheses: a landing page or app-redirect issue specific to Android, or a postback/tracking gap on that device segment. It explicitly notes it can’t distinguish between the two from the data alone — that requires checking the actual LP behavior and postback logs.
This gives a strong hypothesis to verify, not a diagnosis. Checking the landing page on an actual Android device confirms the real cause: a redirect script recently added for a different tracking integration was firing incorrectly on Android Chrome, sending a portion of users into a loop before they ever reached the offer. iOS and desktop weren’t affected because the redirect logic branched on user agent.
The fix is a one-line correction to the redirect script. The lesson is the one this whole article keeps coming back to: the campaign-level average looked like a creative or offer problem. The segmented data pointed at a specific device. The actual cause was neither creative nor offer — it was three lines of broken redirect code that a “just launch new creative” reaction would never have touched.

Fig. 4 — Stable clicks with falling CVR rules out a delivery problem and points toward the funnel, the offer, or tracking.
AI Diagnostic Decision Tree
A compact version of the framework above, built for a quick gut-check the moment something looks off.
- Clicks down? → Check delivery, budget, bid, and the source itself.
- Clicks stable but CVR down? → Segment first, then check funnel, offer, and tracking.
- CTR down specifically? → Check creative fatigue and audience saturation.
- CVR down in one GEO only? → GEO-specific issue — offer eligibility, compliance restriction, or local traffic quality.
- Conversions suddenly at zero? → Check tracking and postback before anything else. Zero is almost never “the audience stopped buying overnight” — it’s usually a broken pipe.
- ROI down but CVR stable? → Check CPC/CPM, payout terms, and EPC. The cost side moved, not the funnel.
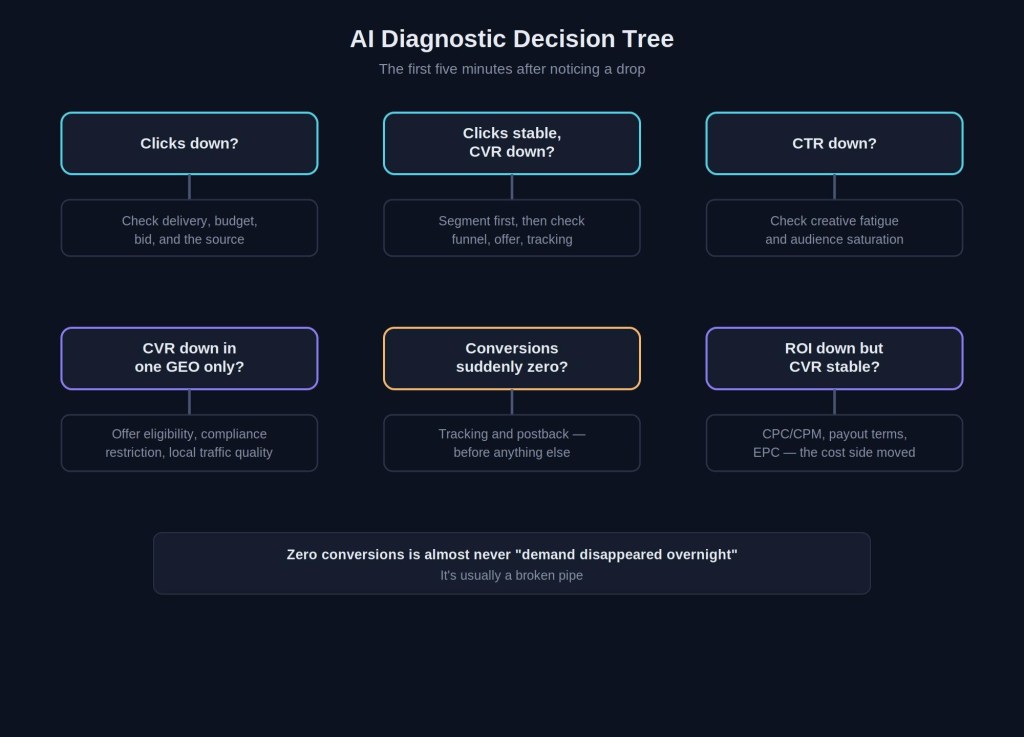
Fig. 5 — The first five minutes after noticing a drop, before touching creative, offer, or budget.
When You Should Trust AI — and When You Shouldn’t
Good AI output: “CVR fell 47%, concentrated in Android traffic from Placement X. Check LP load time, postback firing, and traffic quality for this segment specifically.”
Bad AI output: “Your audience is no longer interested in the offer.”
The first is a testable claim tied to a specific segment and a specific next action. The second is an unsupported story that sounds plausible and explains nothing — it could be true, but nothing in the data actually says so, and there’s no next step attached to it. If an AI output can’t be turned into “go check X,” it isn’t a diagnosis. It’s a guess wearing a confident tone.
Turning AI Diagnosis Into an Automated Workflow
Once the manual version of this process is dialed in, it’s a reasonable candidate for automation — but it’s worth being clear this isn’t a replacement for the checking step, just a way to get alerted faster.
Tracker/Network API → n8n → Data normalization → Anomaly detection → LLM analysis → Ranked hypotheses → Telegram/Slack alert → Human decision
The tracker or network API feeds raw performance data into n8n on a schedule. n8n normalizes it into a consistent format and runs a basic anomaly check against a rolling baseline. Anything that crosses a threshold gets passed to an LLM step with the diagnostic prompt above, and the ranked hypotheses land in a Telegram or Slack channel — not as an automatic action, but as a heads-up with a starting point already attached. A human still makes the call. If you’ve already got a reporting pipeline built in n8n, this slots in as an additional branch rather than a separate system — see AFFStudio’s guide on building an automated affiliate reporting system with n8n for the base architecture this extends.

Fig. 6 — AI ranks hypotheses; a human still verifies and decides.
Common Mistakes When a Campaign Stops Converting
- Changing everything at once — new creative, new bid, new offer, all on the same day. Even if performance recovers, you’ll never know which change fixed it.
- Looking only at campaign-level averages. The Aragil point applies well beyond creative: a blended number can hide a single dead segment for weeks.
- Ignoring postback/tracking as the first check. It’s the least glamorous hypothesis and the most common actual cause.
- Blaming the creative first, because it’s the easiest thing to change, not because the data points there.
- Treating AI output as fact instead of as a list of things to verify.
- Using the wrong baseline — comparing against last week when last week was itself unusual, or against an average that includes a promo period.
- Making decisions on tiny samples. Ten clicks and zero conversions is not evidence of anything yet.
Affiliate Campaign Diagnosis Checklist
- Confirm the conversion drop is real, not a reporting glitch.
- Compare against the right baseline period.
- Check clicks and spend before touching CVR.
- Check CVR, EPC, CPA, and ROI together, not in isolation.
- Check offer status directly with the network or advertiser.
- Check tracking and postback firing rate.
- Segment by GEO, device, and placement.
- Check creative-level CTR and frequency, not just campaign-level.
- Identify the exact date/time the change started.
- Give AI structured, segmented data — not a screenshot.
- Rank hypotheses by evidence, not by how obvious they seem.
- Verify the top hypothesis manually before acting.
- Change one variable at a time.
- Monitor the result against the same segment that broke.
Final Takeaway
When a campaign stops converting, the fastest path to a fix is rarely another creative or a new offer. It’s finding exactly where the funnel changed. AI earns its place in this process when it turns a messy pile of campaign data into two or three testable hypotheses instead of a hundred rows nobody has time to read — but the final diagnosis still comes from the tracker, the traffic source, and the offer itself. The model can point. It can’t check.
FAQ
Why did my affiliate campaign suddenly stop converting?
Usually one of six things: a traffic quality shift, a funnel or landing page change, an offer that got paused/capped/geo-restricted, a tracking or postback failure, creative fatigue or audience saturation, or a change on the traffic source’s side. Segment the data before guessing which one.
What should I check when I have clicks but no conversions?
Postback and tracking first — a silent tracking failure produces exactly this pattern and is easy to miss because nothing throws an obvious error. Then confirm the offer is actually live and eligible for your traffic’s GEO and device mix.
How can AI help diagnose affiliate campaign problems?
By segmenting performance data fast and ranking hypotheses with the evidence behind each one. It’s a research assistant for the data you already have, not a replacement for checking the tracker or the offer directly.
Should I change the creative when conversion rate drops?
Only after confirming the drop is actually a CTR/engagement problem and not a funnel, offer, or tracking issue. A falling CVR with stable CTR almost never means the creative is the problem.
How do I know whether the problem is traffic or the offer?
Segment by source, sub-ID, and placement. If the drop is concentrated in specific segments while others hold steady, it’s more likely traffic quality. If it’s flat across every segment at once, check the offer and tracking first.
Can AI identify the reason for a sudden drop in conversions?
It can identify where the drop is concentrated and propose ranked, checkable hypotheses. It can’t confirm the actual cause on its own — that requires checking the tracker, the offer status, and the traffic source directly.
What data should I give AI to analyze an affiliate campaign?
Segmented exports with clicks, spend, conversions, CVR, CPA, EPC, ROI, GEO, device, placement, sub-ID, and creative — for both the current period and a comparable baseline. Not a dashboard screenshot.



Leave a Reply